2024 Bridge Inventory: Fewer “Good” Condition Bridges, More “Fair” Condition
Federal Highway Administration data shows 274,407 U.S. bridges are rated in good condition, down slightly from 274,675 last year...

This year’s Better Roads Bridge Inventory shows that while the total number of bridges has risen since 2023, the number of bridges rated in “good” condition went down.
Data from the Federal Highway Administration shows that, as of June 15, 2024, the U.S. has 620,762 bridges, up 0.3% from 619,175 seen across the U.S. at the same time last year. Data shows 44.20% of those bridges or 274,407 are rated in good condition, down slightly from 44.36% and 274,675 in 2023.
The percentage of those bridges in “fair” condition rose by 2,217 to 304,620 bridges, which went from 48.84% of all bridges in 2023 to now 49.07%. This category has only grown over the last 5 years, while the number of good condition bridges has only fallen.
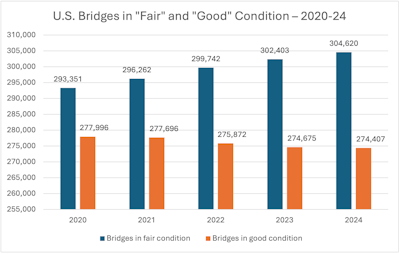 Since 2020, the number of fair condition bridges in the U.S. has risen 3.8%, while the number of good condition bridges has dropped 1.3%.Federal Highway Administration
Bridges rated in “poor” condition in the U.S. now number 41,735, down 0.9% year-over-year and make up 6.72% of all bridges vs. 6.80% last year.
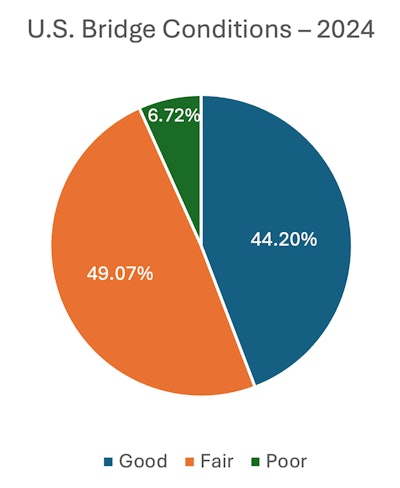 The percentage of U.S. bridges in "poor" condition fell in 2024 to 6.72% from 6.80% in 2023.Federal Highway Administration
Welcome to Equipment World’s 2024 Better Roads Bridge Inventory. What follows are some snapshots from data compiled from FHWA Bridge Condition reports, submitted by departments of transportation for all 50 states and the District of Columbia as of June 15, 2024. We rank the top and bottom states in various categories using that data. At the end of the article, we also provide a detailed look at overall conditions of the bridges in each state, so you can see how your state stacks up.
Note the data shown in this article includes federal bridges and excludes data from Guam, Puerto Rico and the Virgin Islands.
Understanding bridge condition ratings
The Federal Highway Administration asks states to rate bridges that are 20 feet or longer as “Good,” “Fair” or “Poor.”
GOOD – Bridges in this category range from excellent to some minor problems.
FAIR – Ranging from bridges with structural elements showing some minor deterioration, to bridges in which all primary structural elements are sound but may have minor section loss, cracking, spalling or scour; and may include minor erosion on bridge piers.
POOR – There are five categories of poor bridges:
- Poor – Advanced corrosion, deterioration, cracking or chipping. Also significant erosion of concrete bridge condition piers.
- Serious – Loss of section, deterioration, spalling or scour have seriously affected primary structural components. Local failures are possible. Fatigue cracks in steel or shear cracks in concrete may be present.
- Critical – Advanced deterioration of primary structural elements. Fatigue cracks in steel or shear cracks in concrete may be present or scour may have removed substructure support. Unless closely monitored, it may be necessary to close the bridge until corrective action is taken.
- Imminent Failure – Major deterioration or section loss present in critical structural components, or obvious loss present in critical structural components, or obvious vertical or horizontal movement affecting structural stability. Bridge is closed to traffic, but corrective action may be sufficient to put the bridge back in light service.
- Failed condition – Bridge is out of service and beyond corrective action.
Ranking the States
All data come from the Federal Highway Administration’s online National Bridge Inventory as reported by June 15, 2024. It was compared with data reported as of June 15, 2023.
States with the lowest percentage of bridges rated poor
- Nevada – At 1.14% with only 24 bridges out of 2,099 rated in poor condition, Nevada came in first in this category, displacing Arizona from its lead position in last year’s report. In 2023, 1.20% of Nevada’s 2,090 bridges were in poor condition.
- Arizona – With 8,573 bridges within its borders, just 1.15% in Arizona are rated in poor condition. However, this is slightly higher than the 1.11% Arizona reported in 2023.
- Texas – Some 695 or 1.23% of Texas’ bridges are in poor condition, down from the 1.26% the state reported last year and keeping Texas in third place.
- Delaware – Only 11 of Delaware’s 872 bridges are rated in poor condition, bringing it to 1.26%, the same percentage it had last year when it also had the fourth lowest percentage.
- Georgia – This state’s percentage of bridges in poor condition remained unchanged at 1.59%, allowing it to keep its 5th place ranking.
States with the highest percentage of poor rated bridges
- Iowa – Though the percentage of Iowa’s bridges in poor condition dropped since 2023 from 19.22% to 19.16%, it still took the top slot among all 50 states. There are 4,544 poor-condition bridges in Iowa.
- West Virginia – In West Virginia, the percentage of bridges in poor condition dropped over a full percentage point, from 19.69% to 18.64%, shedding its previous ranking as having the highest percentage of poor-condition bridges.
- South Dakota – This state reported 16.36% of its bridges in poor condition, down from 16.73% in 2023 but keeping it in third place.
- Maine – Now with the fourth-highest percentage of bridges in poor condition at 15.41%, Maine previously held the 5th place position in 2023 at 14.76%.
- Rhode Island – In 5th place, Rhode Island saw its percentage of poor-condition bridges decrease from 15.35% in 2023 (then the fourth-highest percentage) to 15.20% now in 2024.
States with the highest percentage of bridges rated good
- Georgia – Maintaining its front-running spot in 2023, 74.84% of Georgia’s 15,069 are rated in good condition, though this was down slightly from 75.45% last year.
- Arizona – In second place again is Arizona, which has 63.46% of its bridges currently rated in good condition vs. 63.55% in 2023.
- Ohio – Once again with the third-highest percentage is Ohio at 61.05%, though this is down from 61.22% in 2023.
- Florida – Another state maintaining its 2023 ranking in this category is Florida, with 59.55% of its bridges currently rated in good condition compared to 60.33% rated in good condition in 2023.
- Nevada – Once again filling the fifth-place slot is Nevada at 58.27%, down slightly from 58.80% last year.
States with the lowest percentage of bridges rated good
- Utah – 22.18% (2023: 24.64%)
- Rhode Island – 22.86% (2023: 22.63%)
- Maine – 24.86% (2023: 25.59%)
- Massachusetts – 25.15% (2023: 25.36%)
- West Virginia – 25.24% (2023: 23.58%)
States with highest percentage of bridges rated fair
- Utah – 74.91% (2023: 72.95%)
- New Jersey – 68.84% (2023: 67.62%)
- Connecticut – 67.49% (2023: 66.67%)
- Kentucky – 66.06% (2023: 67.09%)
- Massachusetts – 65.97% (2023: 66.12%)
States with lowest percentage of bridges rated fair
- Georgia – 23.56% (2023: 22.96%)
- Ohio – 34.21% (2023: 34.14%)
- Arizona – 35.39% (2023: 35.33%)
- Florida – 37.66% (2023: 36.19%)
- Mississippi – 38.84% (2023: 37.62%)
States with lowest percentage of bridge deck area rated poor
- Nevada – 0.78% (2023: 0.76%)
- Georgia – 0.98% (2023: 0.95%)
- Texas – 1.02% (2023: 1.16%)
- Arizona – 1.04% (2023: 1.05%)
- Florida – 1.43% (2023: 1.54%)
States with highest percentage of bridge deck area rated poor
- Rhode Island – 14.07% (2023: 15.25%)
- West Virginia – 12.82% (2023: 15.25%)
- New York – 11.83% (2023: 10.50%)
- Illinois – 11.39% (2023: 11.45%)
- Massachusetts – 11.27% (2023: 10.73%)
A detailed look at all of the states’ bridge ratings
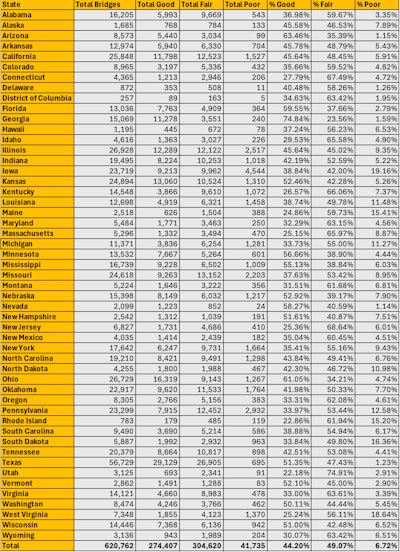 Federal Highway Administration
A detailed look at all of the states' bridge deck area ratings
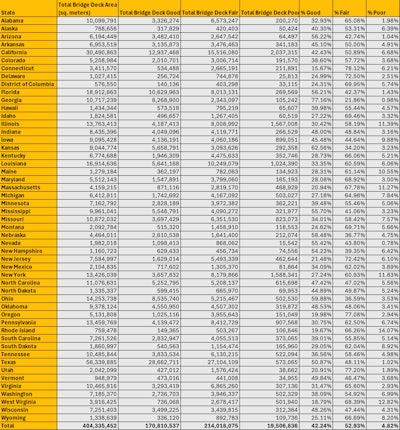 Federal Highway Administration

 machineryasia